Fibonacci retracements are a popular tool used by investors and traders to identify potential levels of support and resistance in a financial market. These levels are derived from the Fibonacci sequence, a mathematical pattern that appears throughout nature and has been applied to financial analysis.
The Fibonacci sequence is a series of numbers where each number is the sum of the two preceding numbers: 0, 1, 1, 2, 3, 5, 8, 13, 21, 34, and so on. The ratio of any two adjacent numbers in the sequence is approximately 1.618, known as the golden ratio, or phi. This ratio also has a reciprocal, which is approximately 0.618.
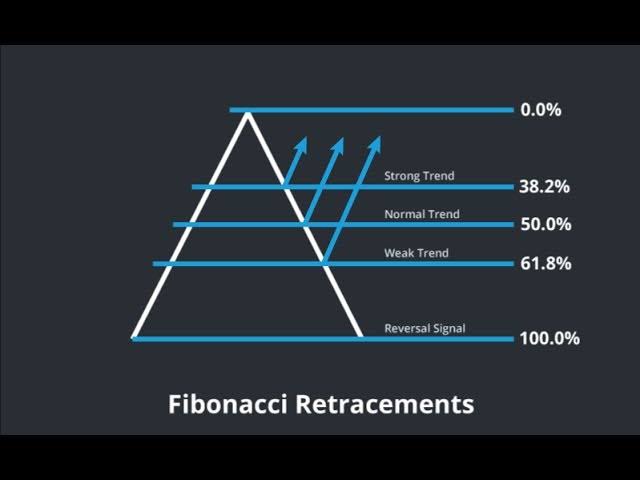
Fibonacci retracements use horizontal lines to indicate areas of potential support or resistance at the key Fibonacci levels before a stock or asset begins to trend back in its original direction. These levels are calculated by taking a high and low point on a chart and applying the Fibonacci ratios of 23.6%, 38.2%, 50%, 61.8%, and 100%.
Traders use Fibonacci retracements to identify potential levels where the price of an asset may reverse, potentially indicating an opportunity to buy or sell. For example, if a stock has been trending upwards and then retraces downwards, a trader might look for potential support at the 38.2% or 50% Fibonacci levels before the price resumes its upward trend.
Similarly, if a stock has been trending downwards and then retraces upwards, a trader might look for potential resistance at the 38.2% or 50% Fibonacci levels before the price resumes its downward trend.
Fibonacci retracements can also be used in conjunction with other technical indicators and chart patterns to confirm potential buy or sell signals. For example, a trader might look for a bullish candlestick pattern at a Fibonacci retracement level before entering a long position.
It is important to note that Fibonacci retracements are not a foolproof tool for predicting market movements, and should be used in conjunction with other forms of analysis and risk management strategies. They are also best used in markets that have clear trends and significant volatility.
In conclusion, Fibonacci retracements are a popular tool used by investors and traders to identify potential levels of support and resistance in financial markets. These levels are derived from the Fibonacci sequence and can be used to help predict potential market movements. However, they should be used in conjunction with other forms of analysis and risk management strategies.