Candlestick patterns are a popular tool used by traders to analyze financial markets and identify potential price movements. A candlestick chart displays the price movement of an asset over a given period of time, and is composed of individual “candlesticks” that represent a single period of time.
Each candlestick has a “body” and two “wicks” or “shadows”. The body represents the opening and closing price of the asset, while the wicks represent the highest and lowest price that the asset reached during that time period. The color of the body is typically green or white for a “bullish” candle, and red or black for a “bearish” candle.

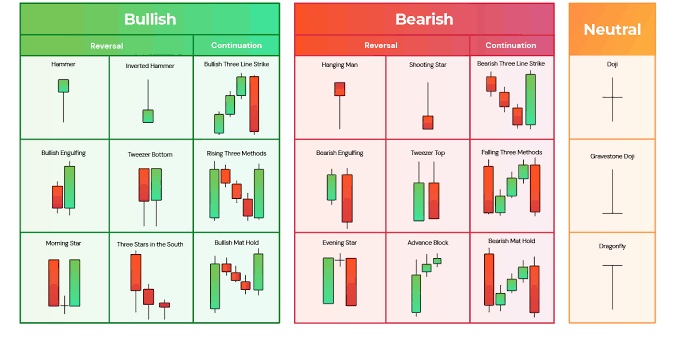
Candlestick patterns are formed by a series of candlesticks that exhibit certain characteristics, which can indicate potential market movements. Some of the most commonly used candlestick patterns include:
- Doji: A doji candlestick pattern occurs when the opening and closing price of an asset are almost the same, resulting in a small body with long wicks. This pattern indicates indecision in the market and can signal a potential reversal in the current trend.
- Hammer: A hammer candlestick pattern is formed when the price of an asset drops significantly during the trading period, but then recovers to close near the opening price. This pattern indicates a potential bullish reversal in the market.
- Shooting star: A shooting star candlestick pattern is the opposite of a hammer pattern. It is formed when the price of an asset rises significantly during the trading period, but then drops to close near the opening price. This pattern indicates a potential bearish reversal in the market.
- Engulfing: An engulfing candlestick pattern occurs when a small candlestick is followed by a larger candlestick that “engulfs” the first. This pattern indicates a potential reversal in the market, with the larger candlestick indicating the direction of the new trend.
- Morning star: A morning star candlestick pattern is a bullish reversal pattern that is formed by a series of three candles. The first candle is bearish, the second is a small candle with a small body, and the third is a bullish candle that closes above the first candle’s opening price.
Candlestick patterns can be used in conjunction with other forms of analysis and risk management strategies to identify potential entry and exit points in the market. It is important to note that candlestick patterns are not a foolproof tool for predicting market movements and should be used in conjunction with other forms of analysis and risk management strategies.